Properties Control Bar
To show or hide this control bar:
-
Setup ribbon >> Show >> Properties Bar.
-
Using the command line, enter "toggle-properties-bar"
-
Use the quick key combination "tpb".
-
Display the Find Command screen, locate toggle-properties-bar and click Run.
-
Right click a file in the Project Files control bar and select Properties.
-
Right click a loaded data object in the Loaded Data control bar and select Properties.
The Properties control bar is a context sensitive settings table, updated on selection of data in the various data windows of your application.
The contents of this control bar vary depending if a physical file (Project Files or Project Data control bar) or loaded data object (Loaded Data control bar) is selected.
Data Properties
The following displays if a data object is selected in the Plots, Reports, Tables and Logs window.
Note: This does not affect 3D window object displays. These can be adjusted using the Data Properties control bar (and other interactive methods).
| General | |
| Name, Object Name | The name of the currently selected item. |
| Full Path | File selections only. The fully qualified path to the physical file. |
| Object Type | The data type of the selected item. |
| Description | A description of a loaded data object. |
| Share |
Share data property changes with other instances of the same data in other logs, reports, tables, sheets and projections.
|
| Source | For loaded data objects, the underlying data source, if available. |
| Store in document | Either Yes or No. If Yes, the data object is stored in the project file. If No, the data object is stored in an external file. |
| Data Table Properties (loaded objects only) | |
| No. Columns | The number of attributes in the selected object. |
| No. Records | The number of data rows in the selected object. |
| Use legend |
|
| Tags | |
| [Name, value] | The name and value of the loaded object's tag. |
| Color | |
| Column | The data attribute currently being used to colour the selected object (using the attribute's associated Legend), if one is used. |
| Use legend |
|
| Color | If Use legend is No, this is the colour used to display the object. |
| Legend | If Use legend is Yes, this is the legend used to colour the object, based on the Column's values. |
| Appearance | |
| Show bounding box |
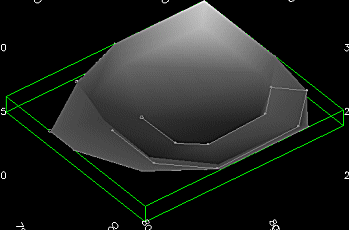
Only applies to Plots window data. If Yes, a cuboid hull displays around the target data object, for example: |
| Control | |
| Can select |
|
| Snap |
|
Plot Sheet Properties
The following options are displayed when a Plan plot sheet is selected (not a plot sheet projection, nor projection section, nor a plot item):
| General | |
| Name | The name of the current plot sheet. |
| Auto size plot |
|
| Auto name sheet |
|
| Appearance | |
| Size | The print media currently emulated in the Plots window. Select the drop-down list for more options. |
| Page orientation | Portrait or Landscape. |
| Draw margins |
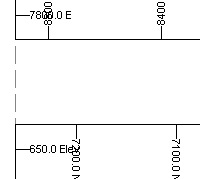
If Yes, margins of the selected media are shown on the screen as guidelines, for example:
|
| Show printable area | Displays or hides a slashed line denoting the limits of the printable area for the selected media. Data falling outside these limits is not printed, and may result in printing errors. |
| Position | |
| Width | The width of the sheet in mm. |
| Height | The height of the sheet in mm. |
| Margins | |
| Top | The top margin of the sheet in mm. |
| Bottom | The bottom margin of the sheet in mm. |
| Left | The left margin of the sheet in mm. |
| Right | The right margin of the sheet in mm. |
Projection Properties
When a plot sheet projection is selected, two additional ribbons appear: Section and View. These context-sensitive ribbons provide access to many of the properties listed below, but possibly in a more convenient way. Where a ribbon alternative exists, it is highlighted below.
The following options are displayed when a plot sheet projection is selected:
| View Direction | |
| Share | If Yes, share the selected projection's view direction with other projections on the sheet. To activate this facility, more than one projection must have an equivalent Share status. Whenever the view direction is changed for any projection, the direction of shared projections is updated automatically. |
| View Direction |
Select a preset view direction, automatically updated Azimuth and Dip values (see below). |
| Azimuth | The azimuth of the projection's view direction. |
| Dip | The dip of the projection's view direction. |
| Align with section |
If Yes, the view direction (and associated property fields) update automatically to be orthogonal to the current section definition. Otherwise, custom azimuth and dip values are used. |
| View Center | |
| Share | If Yes, share the selected projection's view center setting with other projections on the sheet with the same property status. |
| XYZ | The coordinates of the centre point of the projection's view in 3D. |
| Use section mid point |
|
| Appearance | |
| Opaque |
|
| Section Mid-point | |
| Easting | The easting of the projection's section mid point (X). |
| Northing | The northing of the projection's section mid point (Y). |
| Level | The level of the projection's section mid point (Z). |
| Section Orientation | |
| Section orientation | Select a preset to update the Azimuth and Dip values below automatically. |
| Azimuth | Manually override the section definition's azimuth. |
| Dip | Manually override the section definition's dip. |
| Section Definition | |
| Share |
|
| Section Number | The index number of the current section in the section definition table. |
| Title | The name of the section as it appears in the Sheets and similar data control bars. |
| Sections Table | |
| Use section table |
|
| Section Clipping | |
| Apply Clipping | If Yes, data is clipped outside of the current section definition's visibility corridor. See Clipping 3D Data. |
| Share | Not used. |
| Width | The total clipping distance (front and back combined). |
| Front Clip | The distance to clip in front of the projection's section. |
| Back Clip | The distance to clip behind the projection's section. |
| Secondary Clipping | Choose if secondary clipping is applied or not. You can apply secondary clipping to Both, Front or Back. |
| Position | |
| X | The distance from the left edge of the sheet to the projection. |
| Y | The distance from the top of the sheet to the projection. |
| Width | The width of the projection in mm. |
| Height | The height of the projection in mm. |
|
General One or both of these settings can be activated. For example, if both Linked and Live settings are enabled, if data is selected in one projection, it is selected in any other projection on the sheet that has a positive Linked setting, and will also force all linked views to update (if required) in order to show the selected data. By default, all projections are linked, but are not live, meaning that data selection is performed in all projections, but the view scale and direction is not updated. |
|
| Linked | This refers to how data selection is performed in multiple projections. If two (or more) projections are linked, when you select data in one, it becomes selected in the other(s). |
| Live | This refers to whether the view of data is automatically updated to show selected data. |
| Scale | |
| Scale | The current scale ratio of the projection. |
| Share | If Yes, the scale of the projection is shared with other projections within the sharing scope. |
| Locked | If Yes, scaling settings cannot be edited either via the control bar or interactively (in Page Layout mode). |
| View Exaggeration | |
| X | The scaling factor applied to the projection in X. |
| Y | The scaling factor applied to the projection in Y. |
| Z | The scaling factor applied to the projection in Z. |
Plot Item Selections
Plot item properties depend on the type of plot item selected. Select a link for more information:
Note: Some plot items have a location. See Locatable Plot Items.
Related topics and activities


